Real-Time Visualization (Foxglove)
For remote visualization from our Windows development machine, we utilized
Foxglove Studio, a web-based tool that provides cross-platform ROS2
compatibility without requiring native installations. However, transmitting
raw camera feeds over WiFi proved problematic, consuming over 100 MB/s of
bandwidth and causing significant lag.
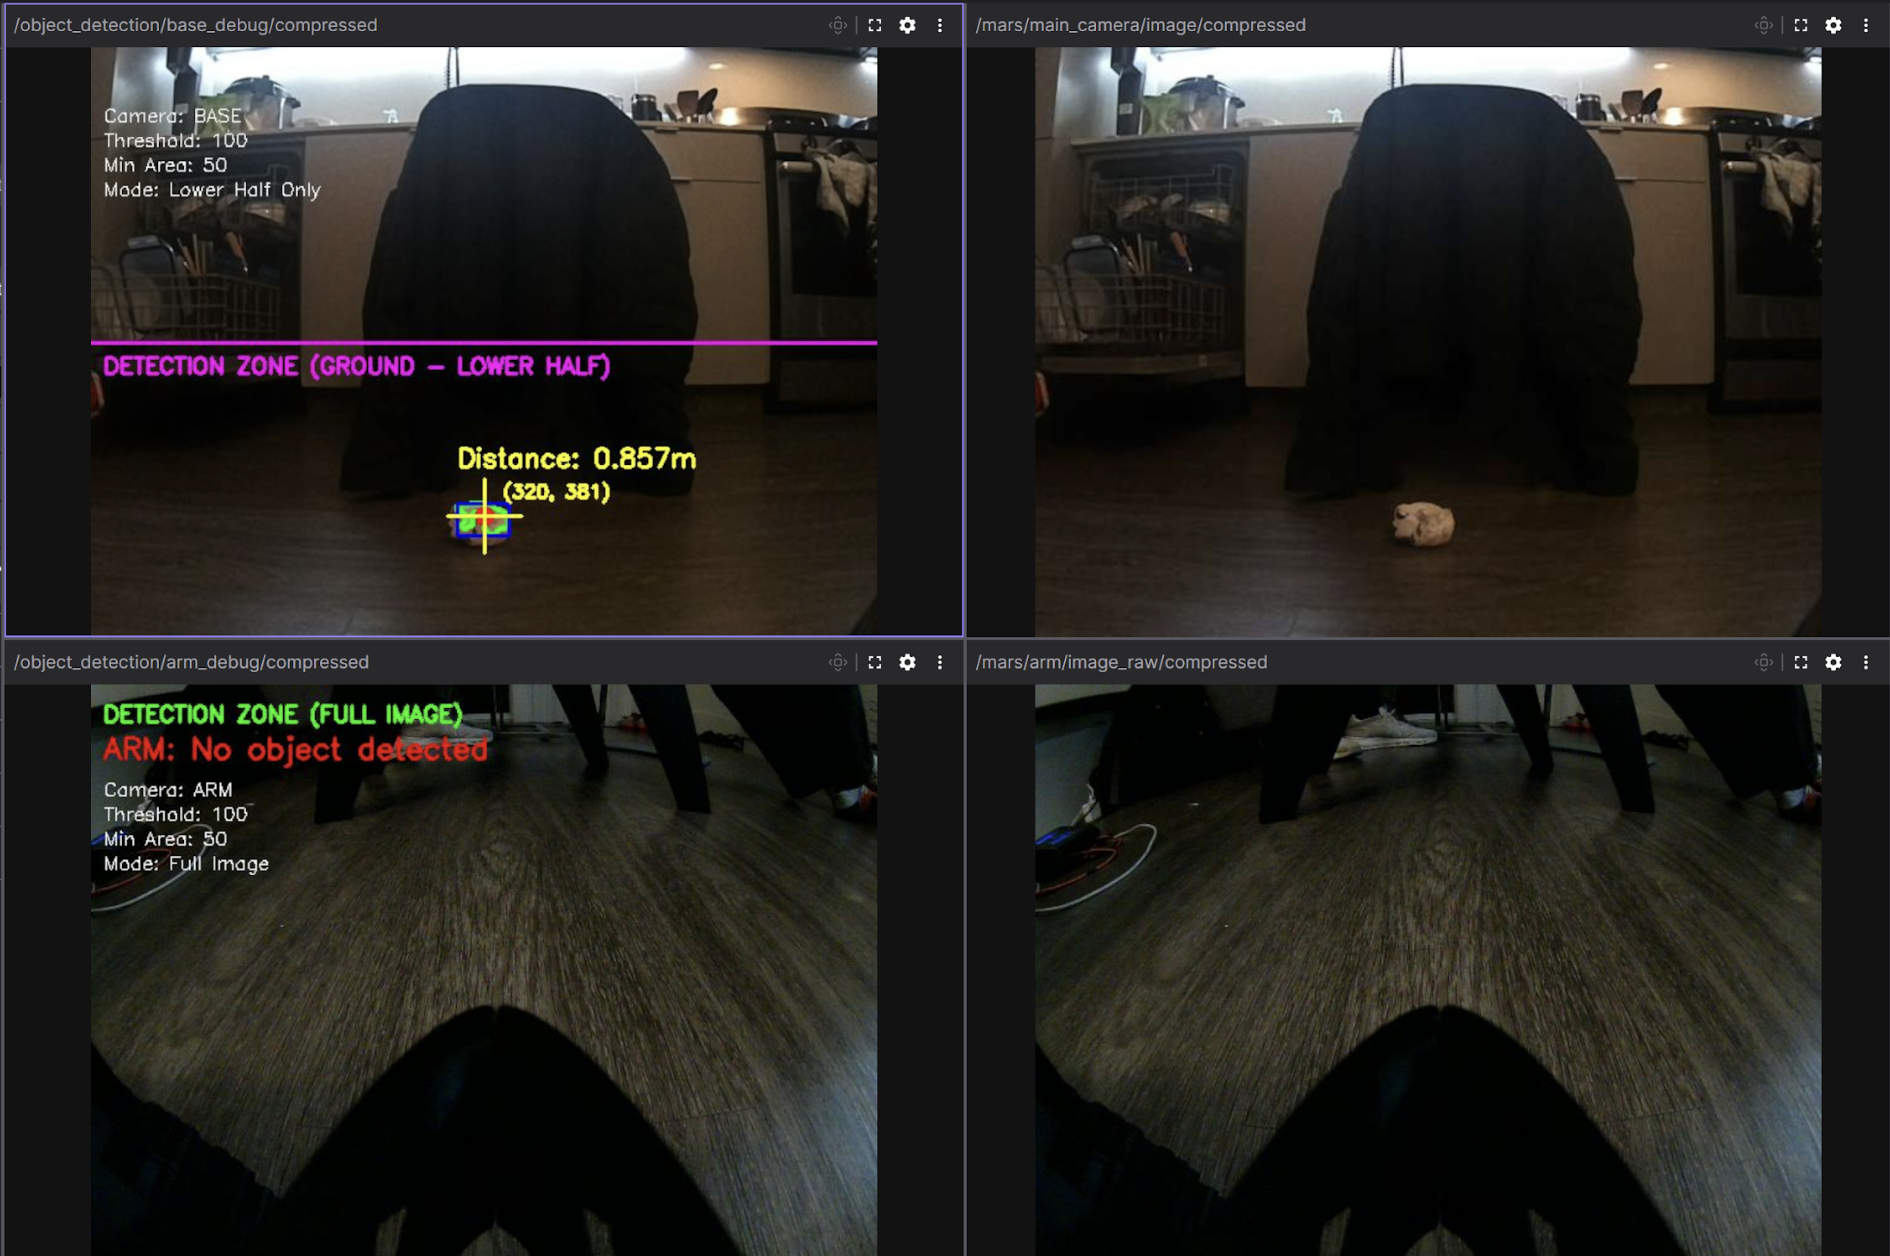
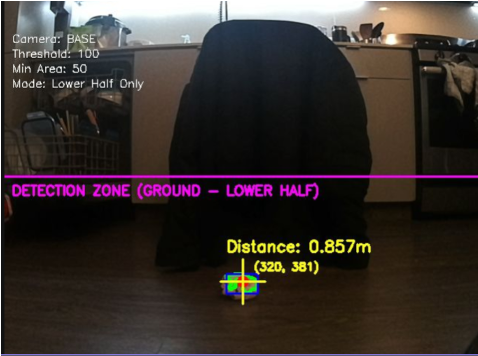
To address this, we implemented custom debug image publishers that overlay
detection data (contours, distances, and detection zones) directly onto
the camera feeds before compressing to JPEG format. This
reduced bandwidth to approximately 7 MB/s, enabling real-time visualization
of the robot's perception and decision-making without network congestion.
# From detect_object.py

def publish_debug_image(self, image, detection, camera_name):
    """Create and publish debug visualization (both raw and compressed)"""
    debug_img = image.copy()

    # Draw detection region boundary
    if camera_name == "BASE":
        cv2.line(debug_img, (0, h_img//2), (w_img, h_img//2), (255, 0, 255), 2)
        cv2.putText(debug_img, "DETECTION ZONE", (10, h_img//2 + 25), ...)

    if detection is not None:
        # Draw contour and centroid
        cv2.drawContours(debug_img, [detection['contour']], -1, (0, 255, 0), 3)
        cv2.circle(debug_img, (cx, cy), 8, (0, 0, 255), -1)

        # Add distance text overlay
        dist_text = f"Distance: {detection['distance']:.3f}m"
        cv2.putText(debug_img, dist_text, (x, y-30), ...)

    # Encode as JPEG for efficient network transmission
    encode_param = [int(cv2.IMWRITE_JPEG_QUALITY), self.jpeg_quality]
    success, compressed_data = cv2.imencode('.jpg', debug_img, encode_param)

    # Publish compressed message
    compressed_msg = CompressedImage()
    compressed_msg.format = "jpeg"
    compressed_msg.data = compressed_data.tobytes()
    self.base_debug_compressed_pub.publish(compressed_msg)